Originally published at: https://www.privacyidea.org/event-based-logging-with-privacyidea-and-logstash/
Keeping track of the system logs in a complex environment with many hosts and even more services can be challenging. A sophisticated logging system with aggregation and filtering capabilities helps the administrator to stay ahead of things. Popular examples are Splunk and Logstash. Both are intrinsically supported by privacyIDEA, since the software builds on the standard python logging library. This article shows how to integrate privacyIDEA in the centralized logging system provided by the elastic stack which consists of the software components Logstash, Elasticsearch and Kibana.
We will use the privacyIDEA logging facility to let the server not only store its system logs and audit locally but also feed them to a remote Logstash server. We will also show how to use the new Logging module of the Event Handler, introduced in privacyIDEA 3.3, to customize the logged information. The usual path of information is displayed in the following picture.

Setup the Base System
As the installation Logstash, Elasticsearch and Kibana is documented at the vendors website, we will not go into detail here. In any case, you need a java runtime environment. For Ubuntu you can use the package default-jre. Once you have the elastic stack up and running, turn towards privacyIDEA.
The installation of privacyIDEA is documented at privacyidea.readthedocs.io. For a quick start, there is a community package repository for Ubuntu 18.04 LTS available. Install the privacyIDEA server and become a little familiar to the WebUI, which is the primary management interface.
The base configuration of privacyIDEA is set in the configuration file pi.cfg and the dedicated logging configuration file logging.cfg or logging.yml. In the default Ubuntu 18.04 package installation, those are located in /etc/privacyidea/. To be able to view the audit logs in the WebUI and send them at the same time to the python logger, the ContainerAudit module is used.
# /etc/privacyidea/pi.cfg
PI_AUDIT_MODULE = 'privacyidea.lib.auditmodules.containeraudit'
PI_AUDIT_CONTAINER_WRITE = ['privacyidea.lib.auditmodules.sqlaudit','privacyidea.lib.auditmodules.loggeraudit']
PI_AUDIT_CONTAINER_READ = 'privacyidea.lib.auditmodules.sqlaudit'
PI_AUDIT_LOGGER_QUALNAME = 'pi-audit'
PI_LOGCONFIG = '/etc/privacyidea/logging.cfg'
Note that we use a custom audit logger name “pi-audit” in the above configuration. See the documentation of the Logger Audit.
Send privacyIDEA logs to Logstash
The logging module privacyidea.lib.auditmodules.loggeraudit sends the audit messages to the python logging system and makes it available to the configuration by logging.yml. To send both the privacyIDEA server logs and the audit log to Logstash, the module python-logstash-async comes in handy. It can be installed through pip by
~$ pip install python-logstash-async
The module can be used in a logging.cfg or logging.yml in YAML and INI format respectively. Minimal examples for the configuration of the logstash-async module are found on Github Gist. A more detailed YAML configuration file is also available, which provides a good basis for this test case.
Restart privacyidea for the changes to have effect. If you used the extended configuration from gist, you should now see the audit log in /var/log/privacyidea/audit.log.
Receive privacyIDEA logs with Logstash
On the other end, Logstash is configured to listen on port 5959 and to forward the logs to Elasticsearch using different indices for the qualnames pi-audit, pi-eventlog and all the rest (privacyidea.*).
# /etc/logstash/conf.d/privacyidea_elasticsearch.conf
# privacyIDEA input is logged by the python-logstash-async module
input {
   tcp {
      port => 5959
      codec => json
      tags => ["privacyidea"]
   }
}
# filter adds metadata field according to logger to
# separate the privacyIDEA audit log from the rest
filter {
   if [extra][logger_name] == "pi-audit" or [extra][logger_name] == "privacyidea.lib.auditmodules.loggeraudit" {
      mutate { add_field => { "[@metadata][indexPrefix]" => "pi-audit" } }
   } else if [extra][logger_name] == "pi-eventlog" {
      mutate { add_field => { "[@metadata][indexPrefix]" => "pi-eventlog" } }
   } else {
      mutate { add_field => { "[@metadata][indexPrefix]" => "privacyidea" } }
   }
}
# Logs are sent to elasticsearch using the indexPrefix
output {
   elasticsearch {
      index => "%{[@metadata][indexPrefix]}-%{+YYYY.MM.dd}"
   }
   # additional output to syslog
   stdout {
      codec => rubydebug
   }
}
Restart logstash afterwards. The output section contains an additional part for logging to stdout. On a systemd-driven system (check ~$ ps -p 1), it can be viewed by
~# journalctl -f -u logstash
Once you interact with the privacyIDEA server, you should see the incoming audit log messages in json format in the journalctl ountput on the logstash machine. The example below is the audit message for viewing the audit log in the privacyIDEA WebUI:
{
          "extra" => {
                    "logger_name" => "pi-audit",
                   "process_name" => "MainProcess",
                    "thread_name" => "MainThread",
                           "line" => 85,
         "logstash_async_version" => "1.6.4",
                           "path" => "/opt/privacyidea/privacyidea/lib/auditmodules/loggeraudit.py",
                      "func_name" => "finalize_log",
                    "interpreter" => "/opt/privacyidea/venv/bin/python",
            "interpreter_version" => "3.6.9"
     },
          "level" => "INFO",
        "program" => "/opt/privacyidea/pi-manage",
           "port" => 47962,
            "pid" => 10047,
      "logsource" => "myhost",
     "@timestamp" => 2020-03-25T15:32:42.748Z,
       "@version" => "1",
           "type" => "python-logstash",
        "message" => "{'success': True, 'serial': '', 'user': '', 'realm': '**', 'resolver': '', 'token_type': '', 'client': '127.0.0.1', 'client_user_agent': 'firefox', 'privacyidea_server': 'localhost:5000', 'action': 'GET /audit/', 'action_detail': '', 'info': '', 'administrator': 'admin', 'policies': '', 'timestamp': datetime.datetime(2020, 3, 25, 15, 32, 42, 748526)}",
           "host" => "henning-t470"
 }
Display privacyIDEA logs with Kibana
The logs received by Logstash are sent to Elasticsearch which talks to the Kibana instance. The Elasticsearch indices should appear in Kibana’s index management, available from the home screen.
The privacyIDEA indices will look like shown below.
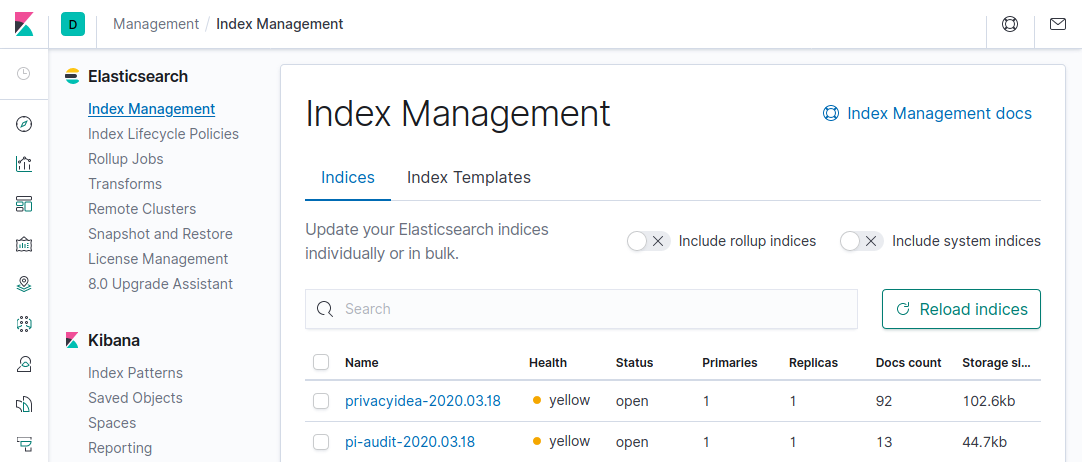
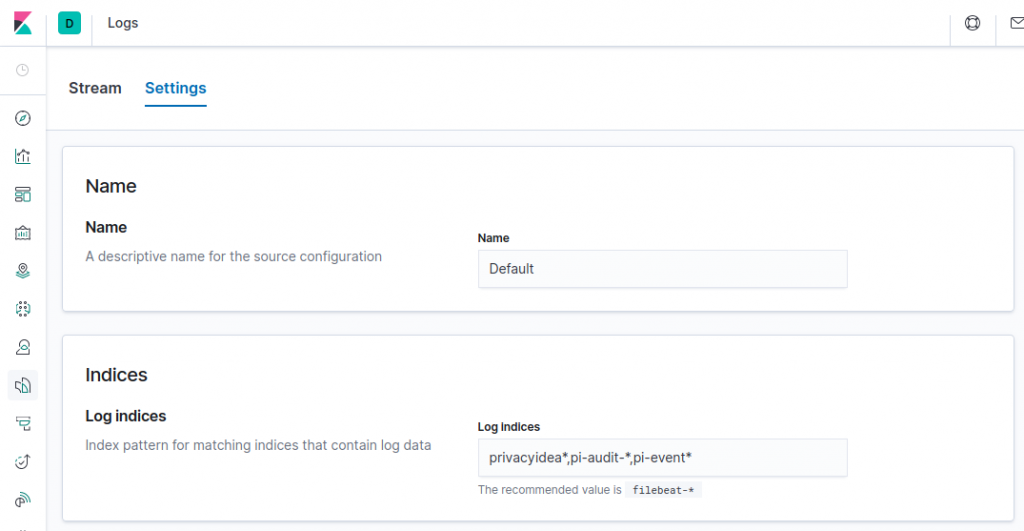
Note: the yellow health status is due to a default index setting "index.number_of_replicas": "1". Changing it to zero will result in a green status. In the Logs settings, add the index names to the listed indices.
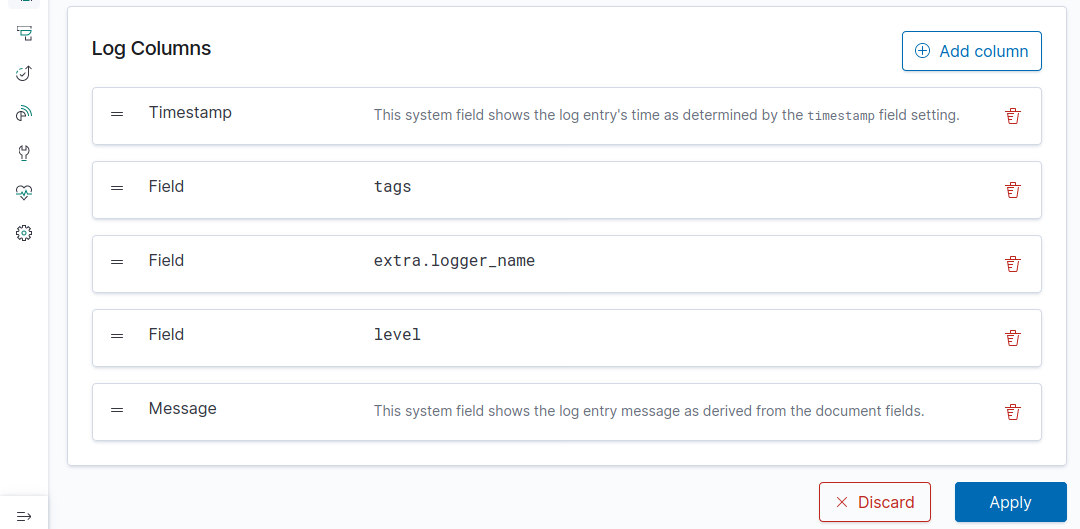
At the bottom, the displayed log columns can be configured.
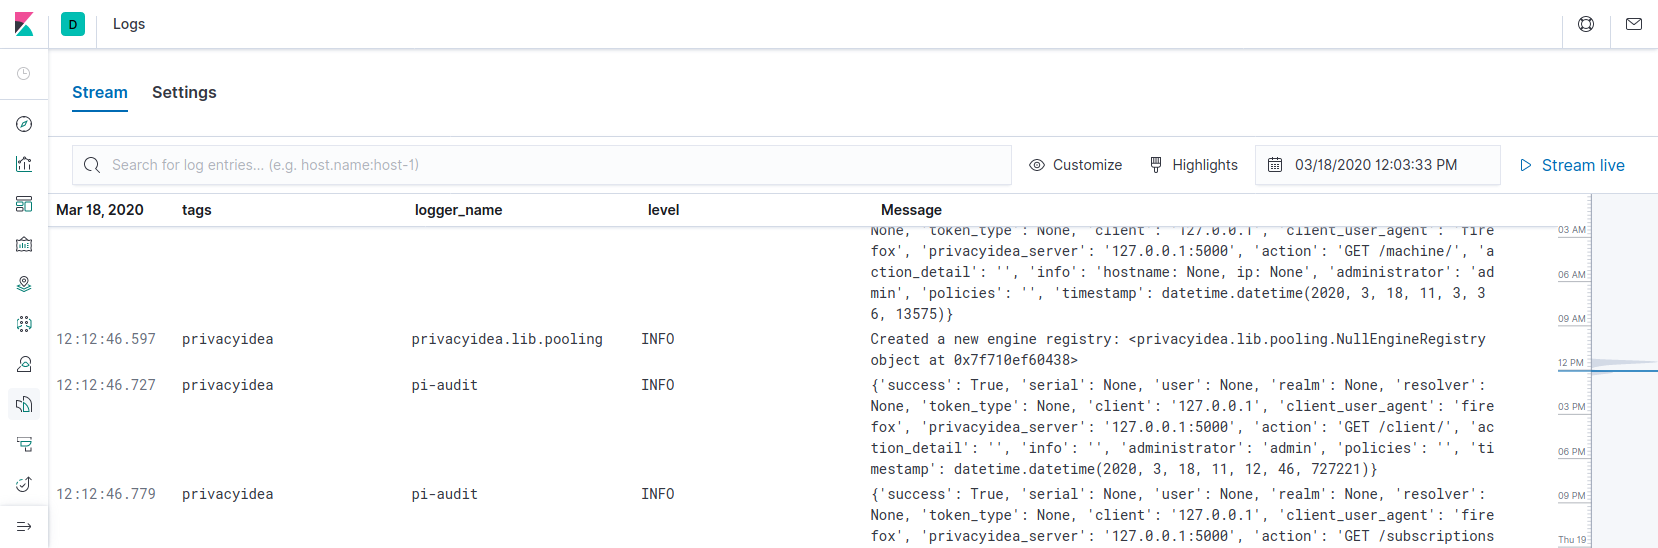
In the Kibana log view, the privacyIDEA log messages are now nicely displayed.
Event-based logging from privacyIDEA to Logstash
New in privacyIDEA 3.3 (Link to 3.3 Release notes) is the Event Handler module “Logging”. With this module, custom logging messages can be bound to any event. This opens the door to a whole new world of monitoring possibilities in privacyIDEA. To demonstrate the feature, we simply log whenever a token is disabled — a silly example, of course. The Event Handler is created as shown below.
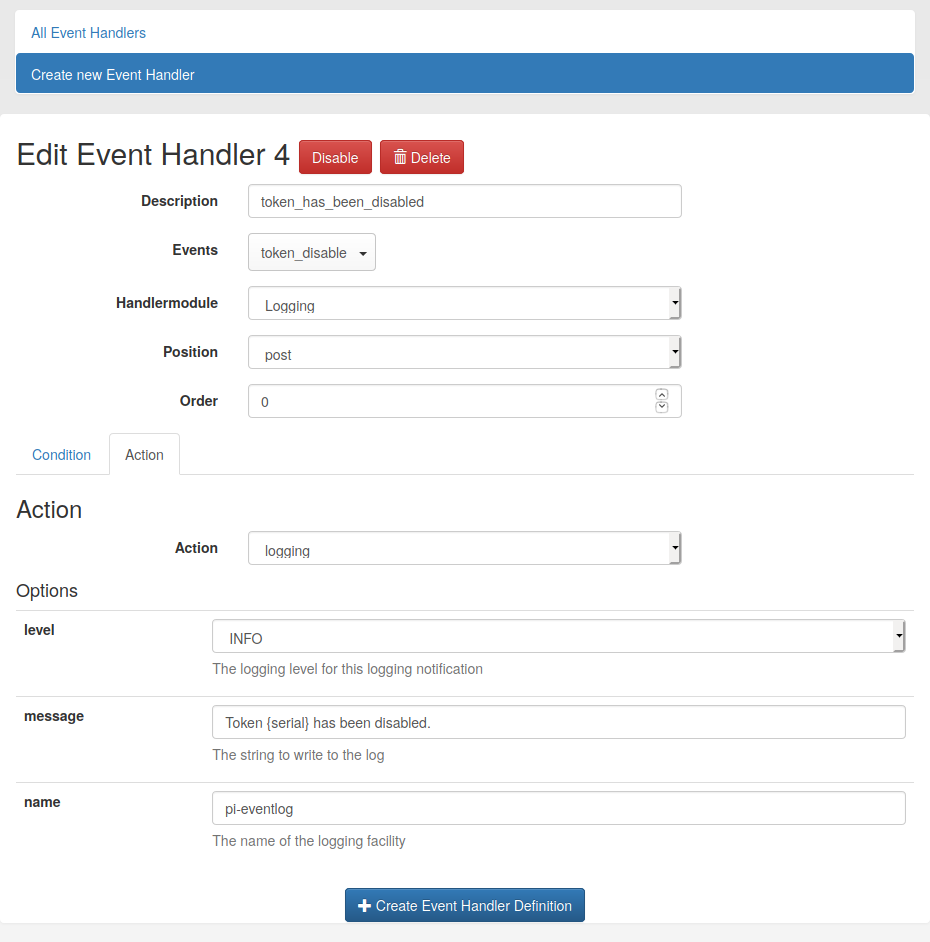
For the Logging module, only one action is available. The log level, the name of the logger and a custom message are required. The message field supports variables known from the user notification module (see documentation). Note, that it depends on the context of the RESTful API event if a certain variable is available or not.
The chosen logger name has to be added as a logger in logging.yml to send it to Logstash.
loggers:
  pi-eventlog:
    handlers:
      - logfile
      - logstash_async
    level: DEBUG
Restart privacyIDEA to apply the changes in the config file logging.yml. After triggering the event by disabling a token in privacyIDEA, Kibana shows the notification.
Of course, you can use the logging event handler for more reasonable purposes like not to send the full audit log to logstash but to single-out the important validate-check events. You can even apply some more conditions, if you like making use of the powerful condition properties of the privacyIDEA Event Handlers. This not only spares bandwidth and storage space but prevents important information to be buried by other data. The message field in privacyIDEA can be used for a custom log message with contextual information. The configurable logger name (e.g. pi-validate-check) provides an additional identifier. In the case of suspicious behavior or a security incident, all the information is there to quickly track down the threat.
Conclusion
With this demonstration of the logging facility, privacyIDEA proves again to be extraordinarily scalable. It integrates well with logging systems like Logstash and Splunk since the privacyIDEA server builds on the standard python logging library. For Logstash, this article showed the detailed steps how to integrate privacyIDEA via the loggeraudit and a small third-party python module called python-logstash-async.
In privacyIDEA 3.3 the logging capabilities have been further extended by an Event Handler module which enables to conditionally log arbitrary events to the python logging system. We showed that also these messages can easily be passed to Logstash and open a vast playground custom logging.
The solution shown here is only one possible approach. Since privacyIDEA is available as open source an licensed under the AGPL, another possibility would be of course to write your very own logger module to do whatever you want. privacyIDEA is and will be always open source and therefore it will always stay in your hands.
If you would like to have a custom logger module, but have no time to implement it yourself, you can always request a quote from Netknights, the company which drives the privacyIDEA innovation via Github. They also provide professional support for privacyIDEA, including enterprise repositories for Ubuntu and CentOS/RHEL containing the server and a number of additional components and tools.